Addigy's Historical Reports feature allows you and your team to define and arrange your own set of data reports that showcase the value you drive to your clients and organization.
Reports, Dashboards, and Exports
Report
A report is a collection of charts displaying data from your account. For example, the "Compliance Performance" report displays several charts related to your fleet's compliance.
You can create new custom reports for your admins to check regularly or to share with internal stakeholders.
Dashboard
Dashboards continue to exist in Addigy and show up-to-the-minute data. While historical data is gathered each day (12am EST), dashboards are for when you need current data.
Data Exports
Another separate but related feature is Data Exports, which let you combine Addigy data with other platforms and services in tools like Power BI.
Creating a Custom Report
- In the main navigation, click "Dashboards" and, under "Reports", click "Add..."
- Add a title for the Report and then click "Add Charts"
All admins in your team can see the reports you create, but only the person that created the report can edit or delete it.
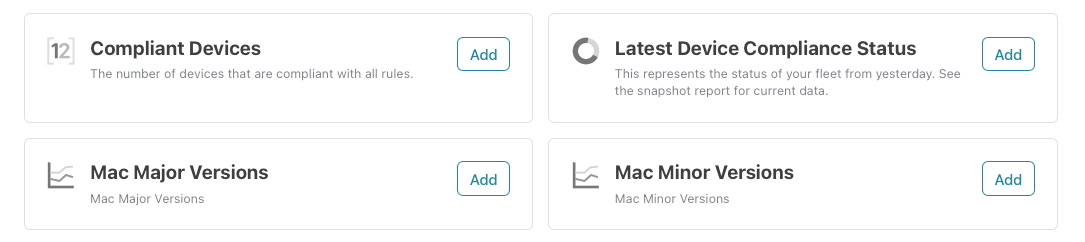 Available Charts
When creating or editing a report, you can select from a list of available charts to add. The list covers some of the most critical data points you’ll need regarding security, system updates, and more. More charts will be added regularly. If you have an idea for a chart, please use the feedback link provided at the bottom of the report.
Historical Data
One of the most significant features of Custom Reports is the historical data underlying each report. This allows for reports that show changes over time for a particular data point, so that you can see a history of your fleet’s status and see progress for a given date range. Data is collected each night at approximately 12 a.m. EST.
Visualizing Data
Charts are available as doughnut charts, line charts, bar charts, or single-value scorecards. Besides the data displayed initially, you can also click the 3-dot icon in the upper-right corner of each report for other options. For example, the View Data option displays the underlying data where you can search for a device and view its GoLive page.
Editing a Custom Report
For any report that you create, you'll see an "Edit Report" link at the top right. Click it to access the edit screen. Make any changes necessary and click Save. To delete a report, find the delete button at the bottom of the edit screen.
Prebuilt Reports
Some reports have been prebuilt for your account and are available in the Dashboards navigation menu when you enable the integration. One of them, for example, is the "Software Updates" report so you can see how OS versions are deployed across your fleet.
Permissions Required
- View Reports
- Export Reports Data